Introduction
In part of the scientific writing process one sometimes overlooked but important aspect to the final document is the captioning of figures and tables. These are as important, if not more than the actual figure or table because they explain and provide the necessary context to understand what is displayed in a figure or table. Importance aside, it is easy to wait to the last minute to write out the captions, but at least in my workflow, I can’t really focus on the results for the main text until the figures and tables are settled. Inevitably the figures and tables change in terms of the information presented or order as part of the writing process and your thoughts unfold, but that does not preclude tackling the caption and getting it done!
Anatomy of a caption
Technical scientific writing is purposely standardized in many respects. Most articles follow the IMRaD format with an Introduction, Methods, Results, and Discussion where we know exactly where to look for the information we as a reader might be interested in. The caption for a figure or table is not much different, there too is a standard format that organizes the information in the caption.
A figure or table caption contains at least 1 sentence that describes the figure or data broadly and includes where and when the data is collected if necessary. The last ‘if necessary’ might be a bit unclear but what that means is that you might not need to report about the location or the time when the data was collected if it is reported in the figure or table. Below is an example of a study area figure, figure 1 in Herrala et al. (2014).

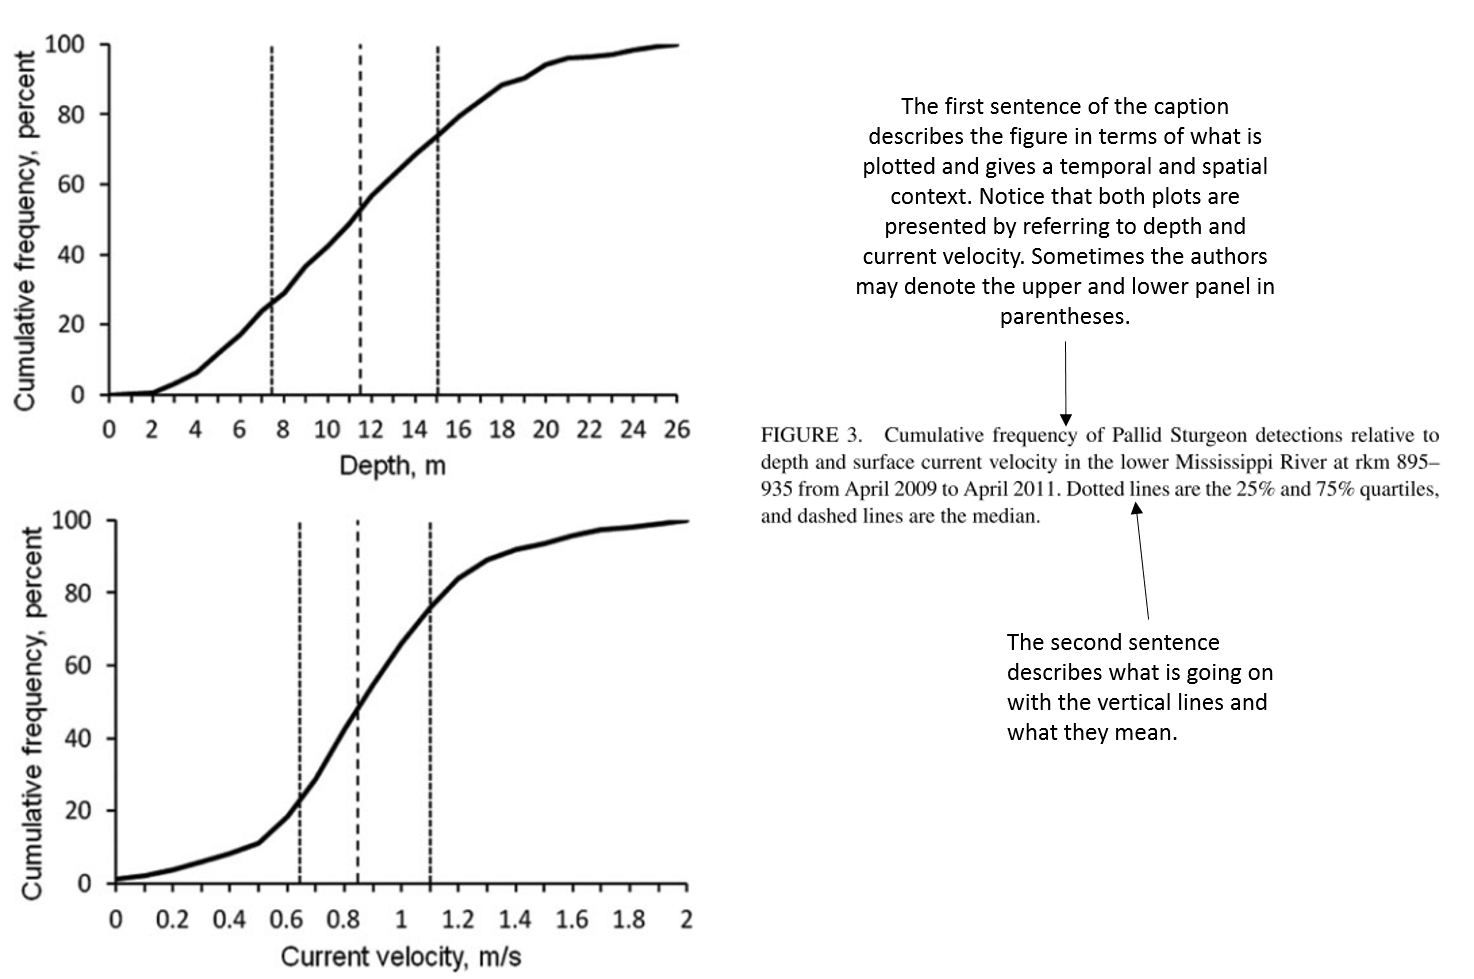
Below is an another example of, figure 3 in Herrala et al. (2014). It is a 2 panel figure there the first sentence of the caption describes each panel along with the temporal and spatial context.
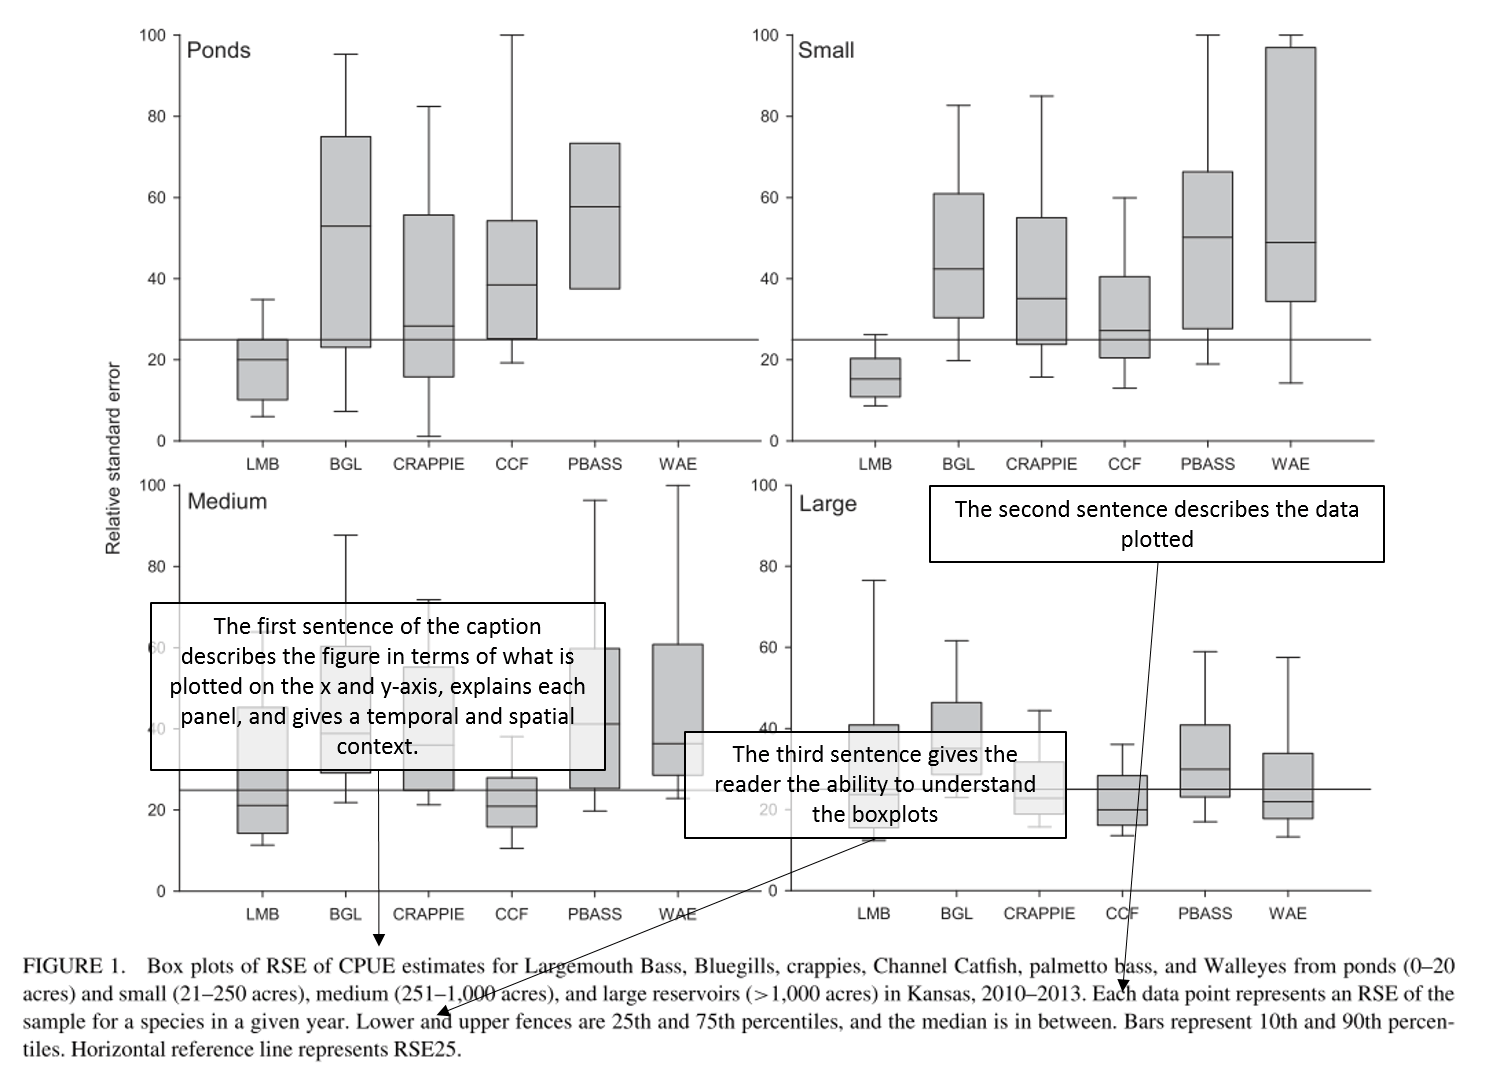
The figure below is an example from Koch et al. (2014), figure 1 therein, that has multiple panels. The first sentence describes the x and y axes each panel and the temporal and spatial context.
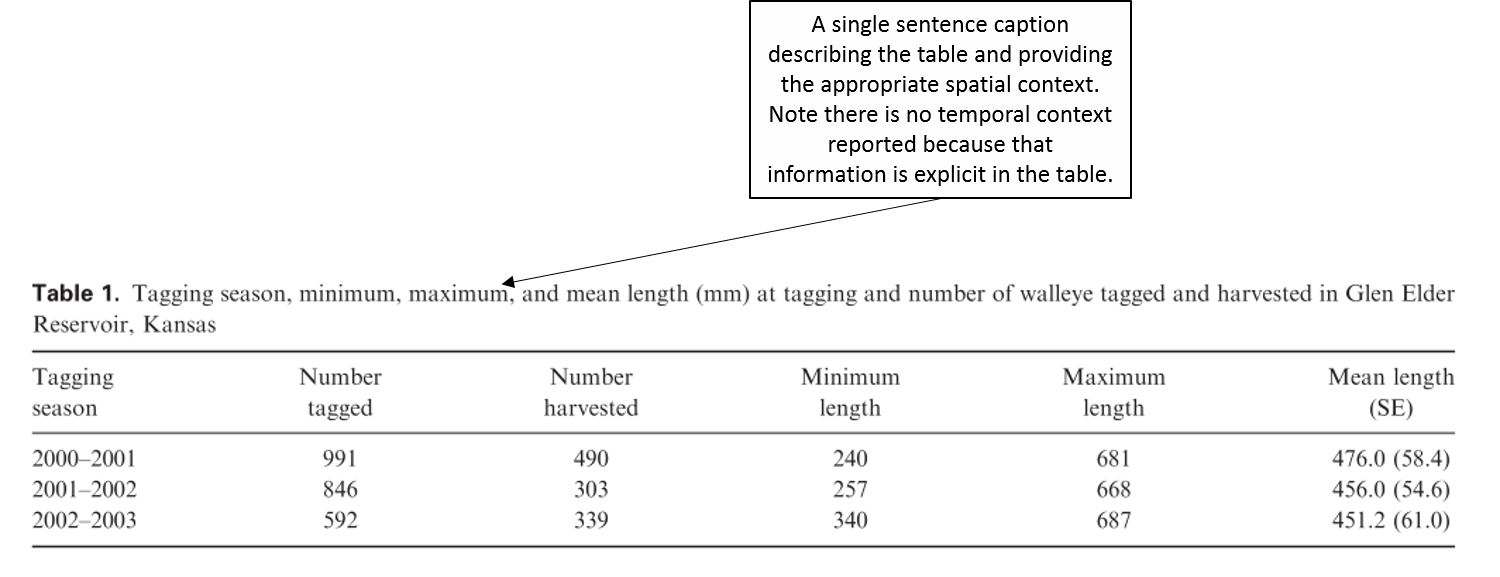
For example the caption for the table below from Quist et al. (2011) provides a broad overview of the data and a location but there is no information about when the data was collected as this is contained in the table itself.
A checklist for a figure or table caption
While there is no perfect formula for a figure or table caption the guidelines below should assist in writing out those pesky captions.
- A first sentence that broadly describes the data and reports when
the data was collected and where, unless that information is covered
in sufficient detail in the figure and table.
- In the broad description for a figure concisely describe the figure type (e.g., barplot, boxplot, scatterplot, lineplot), what is reported on the x-axis and the y-axis. Use your best judgment here, it may not be necessary to describe things that are commonly known like months or years.
- There might be multiple panels and so denoting in the caption differences in top and bottom panels or each panel if they are denoted by letters or numbers.
- Sentences in addition to the first sentence including
- Descriptions of any relevant information needed to understand the figure like what symbols mean
- What abbreviations mean
- What colors mean.
- Additional sentences needed to describe there may be other
information presented in a figure like
- lines denoting standard errors or 95% confidence intervals, and
- values of interest, or the quartile ranges of a boxplot.
References
Herrala, J. R., P. T. Kroboth, N. M. Kuntz, and H. L. Schramm. 2014. Habitat Use and Selection by Adult Pallid Sturgeon in the Lower Mississippi River. Transactions of the American Fisheries Society 143:153-163.
Koch, J. D., B. C. Neely, and M. E. Colvin. 2014. Evaluation of Precision and Sample Sizes Using Standardized Sampling in Kansas Reservoirs. North American Journal of Fisheries Management 34:1211-1220.
Quist, M. C., J. L. Stephen, S. T. Lynott, J. M. Goeckler, and R. D. Schultz. 2011. Exploitation of walleye in a Great Plains reservoir: harvest patterns and management scenarios. Fisheries Management and Ecology 17:522-531.