Overview
One of the biggest issues I have with my workflow is not the writing portion but the number of intermediate steps needed to get figures and tables ready for a report or publication. In my workflow for writing reports and publications I have 2-3 word documents that I have open on 2 monitor. The first most important word document I have open on my left monitor is the text of the report or manuscript. I like to keep tables and figures in a separate word document to work from on a monitor on the right side.
There have been calls for scientists to do reproducible research and to use tools like LaTeX and markdown to write report text, embed code for figures and tables and then build the report as a html, pdf, or word document. The text format of the working files is well suited to version control using tools like Git and Github and can be used by all operating systems. However, these tools are not mainstream and working with teams of scientists will force you to use conventional tools like MS Word to bat drafts back and forth, provide comments and edits on drafts, and submit to journals—although you can submit LaTeX to some journals. I have yet to work on a team where report drafts are not produced in MS Word, DOCX files are the norm and markdown, R markdown, and LaTeX files are the exception in fisheries.
I recently discovered the officer and flextable packages which I
have found to greatly streamline my workflow related to generating DOCX
files with tables and figures that are generated from R and other
sources. A simplified workflow consists of:
- Writing a main draft of the report or manuscript in MS Word, being sure to use themes and headings,
- Do analysis is R, generating figures and tables (albeit tables needs formatting before they are report ready,
- Read the main draft DOCX into R,
- Append the figures and tables to the main draft that has been read into R (note you can source external images, for example a study area generated using ArcMap),
- Save the full report or manuscript built in R to a DOCX file.
This process has one major advantage, specifically it makes interacting
with edits much easier. Specifically, on of the most significant
challenges of working with markdown files is trying to translate
comments from a DOCX file back to the master md document. The
paragraphs and lines do not line up and it is really easy to lose your
place which in turn means you waste more time trying to edit, at least
in my experience. The section below demonstrates how to read in a DOCX
and append document elements using R and then save the file as a
compiled DOCX that can be distributed to coauthors. Once comments are
received the main draft simply needs to be edited and any edits to the
figures and tables can be done in R.
A workflow
I the folder reports I have 4 files Download
folder:
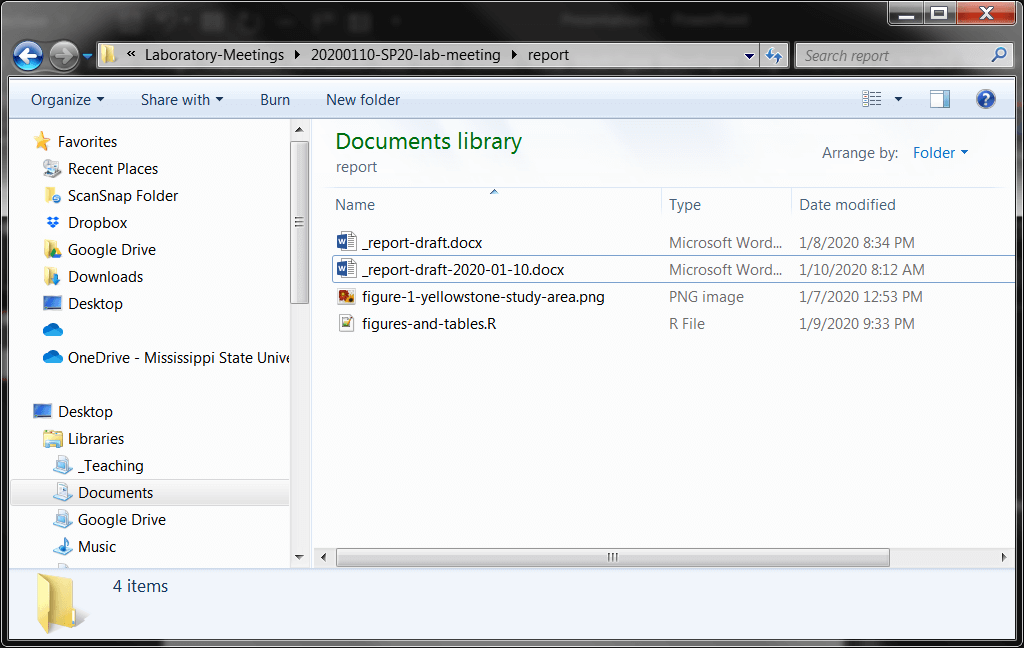
_report-draft.docxmy main working draft of the reportfigure-1-yellowstone-study-area.pnga study area figure made in ArcGis that I want to usefigures-and-tables.Rthis script reads in my working draft and appends all the figures and tables_report-draft-2020-01-10.docxthis is the full draft that has text, figures, and tables.
The code below is the code in figures-and-tables.R
First we need to load the officer and the flextable packages.
library(officer)
library(flextable)
Next we can read in the main text of our report.
## READ IN YOUR MAIN DOCUMENT
my_doc<- read_docx("_report-draft.docx")
Now we can start to add the bits of code needed. Below we add a new heading in the document at the heading 1 level to denote the figures.
# Figures
my_doc<- body_add_par(my_doc, value = "Figures", style = "heading 1")
The code below reads in a figure that was made outside of R and adds it to the report. It also places a figure capture and a page break after the figure.
## FIGURE 1 - A STUDY AREA MADE OUTSIDE R
my_doc<- body_add_img(my_doc,src = "figure-1-yellowstone-study-area.png",
    width = 6.5, height = 6.5, pos = "after")
my_doc <- body_add_par(my_doc,"Figure 1. Study area.", style = "caption")
my_doc<- body_add_break(my_doc)
The chunk of code below makes a figure in R and saves it .png to a
temp folder and hen reads it back in and adds it to the report along
with a caption and a page break.
## FIGURE 2 - A FIGURE MADE IN R
src <- tempfile(fileext = ".png")
png(filename = src, width = 6.5, height = 6.5, units = 'in', res = 300)
hist(rnorm(1000,0,1))
dev.off()

## png
##   2

my_doc<- body_add_img(my_doc,src = src,
    width = 6.5, height = 6.5, pos = "after")
my_doc <- body_add_par(my_doc,"Figure 2. Caption goes here.", style = "caption")
my_doc<- body_add_break(my_doc)
Another demonstration of adding a figure to the document. The only difference in the code below is you will notice a continous break instead of a page break. This will allow us to make Figure 4 a landscape figure.
## FIGURE 3 - A FIGURE MADE IN R
src <- tempfile(fileext = ".png")
png(filename = src, width = 6.5, height = 6.5, units = 'in', res = 300)
hist(rnorm(1000,0,1))
dev.off()

## png
##   2

my_doc<- body_add_img(my_doc,src = src,
    width = 6.5, height = 6.5, pos = "after")
my_doc <- body_add_par(my_doc,"Figure 3. Caption goes here.", style = "caption")
my_doc<- body_end_section_continuous(my_doc)
Sometimes you need to have a figure in landscape orientation. The code below does that and the last line of code stops the landscape orientation.
## FIGURE 4 - A FIGURE MADE IN R--- but landscape
src <- tempfile(fileext = ".png")
png(filename = src, width = 9, height = 5.5, units = 'in', res = 300)
hist(rnorm(1000,0,1))
dev.off()

## png
##   2

my_doc<- body_add_img(my_doc,src = src,
    width = 9, height = 5.5, pos = "after")
my_doc <- body_add_par(my_doc,"Figure 4. Caption goes here.", style = "caption")
my_doc<- body_end_section_landscape(my_doc)
Adding tables
Now that the figures are done we can add some tables. I simulated some here for reproducibility but you make a table in R or read it in from excel and format it. One note, you cannot do really really big tables. The code chunk below adds “Tables” as a heading 1 to the word document.
# TABLES
my_doc<- body_add_par(my_doc, value = "Tables", style = "heading 1")
Now lets add table 1 to the word document we are building.
## TABLE 1---
tbl1<-data.frame(treatment=rep(letters[1:3],5),
    measurement1=rnorm(15,0.1),
    measurement2=rnorm(15,0.1),
    measurement3=rnorm(15,0.1),
    measurement4=rnorm(15,0.1),
    other=runif(15,1000,10000))
tbl1<-tbl1[order(tbl1$treatment),]
Now that table 1 is built and some sorting done we can add the table to
the word document in R. First we will figure out which columns we want
and then make a flextable of those columns.
indx<-c("treatment","measurement1","measurement2","measurement3","other")
tbl1<-flextable(tbl1,col_keys=indx)
tbl1<-set_header_labels(tbl1,
    values = list(
        treatment="Treatment",
        measurement1="1",
        measurement2="2",
        measurement3="3",
        other="Other measurement"))
When we have multiple columns with the same name we generally want to add a common field name. The code below adds a row to the header of the table and then gives a common name to columns 2, 3, and 4. Note the rest of the columns will have nothing in them.
tbl1 <- add_header(tbl1, values = list(
        measurement1="Occasion",
        measurement2="Occasion",
        measurement3="Occasion"), top = TRUE)
Now we will center the first row of the header that we just added and
merge the common cells with merge_h.
## ALIGN THE FIRST ROW AND COLUMNS 1 TO 4: CENTERD
tbl1 <- align(tbl1,i=1,j=1:4,align="center",part="header")
## HORIZONTAL MERGE OF THE HEADER
tbl1 <- merge_h(tbl1, part = "header")
Now we can do some vertical merges to take care of redundant values in the treatment column and align that at the top of the cells which is conventional for this discipline.
## MERGE THE TREATMENT CELLS
tbl1 <- merge_v(tbl1,j = c("treatment"))
## VERTICAL ALIGN THE TREATMENT COLUMNS (j=1)
## IN THE BODY TO THE TOP
tbl1<-valign(tbl1,j = 1, valign = 'top',part="body")
We can use the code below to make the font size smaller and the same as the main report draft, in this case I want the Georgia font all size 11.
## FORMAT THE FONT AND THE FONT SIZE IN THE TABLE
tbl1 <- font(tbl1, fontname = "Georgia",part="all")
tbl1 <- fontsize(tbl1, size = 11)
Now we need to fix the borders of the table, they are all messed up so first we will remove all the borders and then add them back.
## NOW TO FIX THE BORDERS
border<-fp_border(color="black", width = 1)
## REMOVE THE BORDER
tbl1<-border_remove(tbl1)
## ADD A HORIZONTAL LINE IN THE HEADER ON THE FIRST ROW
## AND COLUMNS 2-4
tbl1<-hline(tbl1,i=1,j=2:4,part="header",border = border)
## ADD A LINE AT THE BOTTOM OF THE BODY
tbl1 <- hline_bottom(tbl1, part="body",border = border)
## ADD A LINE AT THE BOTTOM OF THE HEADER
tbl1 <- hline_bottom(tbl1, part="header",border = border)
## ADD A LINE AT THE TOP OF THE HEADER
tbl1 <- hline_top(tbl1, part="header",border = border)
The autofit function adjusts the column widths.
tbl1<-autofit(tbl1)
Now we are going to append a caption, the flextable and set a continuous break so we can do the next table as a landscape table.
my_doc<- body_add_par(my_doc, value = "Table 1. caption.",
    style = "caption")
my_doc<- body_add_flextable(my_doc, tbl1)
my_doc<- body_end_section_continuous(my_doc)
The code below is the same as above but is is a much larger table and we want this one to be landscape orientation.
## TABLE 2--- A LONG TABLE IN LANDSCAPE
tbl1<-data.frame(treatment=rep(letters[1:3],50),
    measurement1=rnorm(150,0.1),
    measurement2=rnorm(150,0.1),
    measurement3=rnorm(150,0.1),
    measurement4=rnorm(150,0.1),
    other=runif(150,1000,10000))
tbl1<-tbl1[order(tbl1$treatment),]
indx<-c("treatment","measurement1","measurement2","measurement3","other")
tbl1<-flextable(tbl1,col_keys=indx)
tbl1<-set_header_labels(tbl1,
    values = list(
        treatment="Treatment",
        measurement1="1",
        measurement2="2",
        measurement3="3",
        other="Other measurement"))
tbl1 <- add_header(tbl1, values = list(
        measurement1="Occasion",
        measurement2="Occasion",
        measurement3="Occasion"), top = TRUE)
## ALIGN THE FIRST ROW AND COLUMNS 1 TO 4: CENTERD
tbl1 <- align(tbl1,i=1,j=1:4,align="center",part="header")
## HORIZONTAL MERGE OF THE HEADER
tbl1 <- merge_h(tbl1, part = "header")
## MERGE THE TREATMENT CELLS
tbl1 <- merge_v(tbl1,j = c("treatment"))
## VERTICAL ALIGN THE TREATMENT COLUMNS (j=1)
## IN THE BODY TO THE TOP
tbl1<-valign(tbl1,j = 1, valign = 'top',part="body")
## FORMAT THE FONT AND THE FONT SIZE IN THE TABLE
tbl1 <- font(tbl1, fontname = "Georgia",part="all")
tbl1 <- fontsize(tbl1, size = 11)

## NOW TO FIX THE BORDERS
border<-fp_border(color="black", width = 1)
## REMOVE THE BORDER
tbl1<-border_remove(tbl1)
## ADD A HORIZONTAL LINE IN THE HEADER ON THE FIRST ROW
## AND COLUMNS 2-4
tbl1<-hline(tbl1,i=1,j=2:4,part="header",border = border)
## ADD A LINE AT THE BOTTOM OF THE BODY
tbl1 <- hline_bottom(tbl1, part="body",border = border)
## ADD A LINE AT THE BOTTOM OF THE HEADER
tbl1 <- hline_bottom(tbl1, part="header",border = border)
## ADD A LINE AT THE TOP OF THE HEADER
tbl1 <- hline_top(tbl1, part="header",border = border)
tbl1<-autofit(tbl1)
my_doc<- body_add_par(my_doc, value = "Table 2. caption.",
    style = "caption")
my_doc<- body_add_flextable(my_doc, tbl1)
my_doc<- body_end_section_landscape(my_doc)
The code below saves the full document as a DOCX file and appends the
current date to the file name.
print(my_doc, target = paste("_report-draft-",Sys.Date(),".docx",sep=""))